INDUSTRY INSIGHTS
ANALYSIS & PERSPECTIVES ON SPORTS MEDIA, VIEWERSHIP, AND DATA-DRIVEN STRATEGY
Model Results: 2025 Bowl Season Attendance Predictions Recap
1/29/2026
At the end of bowl season, we at Collegiate Sports Management Group evaluated our 2025 attendance predictions for the non-CFP bowl games. This analysis focused on overall accuracy, key patterns, and season-long insights instead of individual games.
Big Picture Results
Our post-event analysis showed the model performed well directionally and consistently identified relative demand tiers across the non-CFP bowls.
The model was most effective when distinguishing:
High-demand vs. low-demand bowl games
Destination and regional anchor games
High-profile matchups with more stable attendance profiles
Although exact attendance totals varied, the model met its primary objective by correctly ranking expected demand throughout the bowl ecosystem.
2025-26 BOWL GAME RESULTS
Where the model nailed it
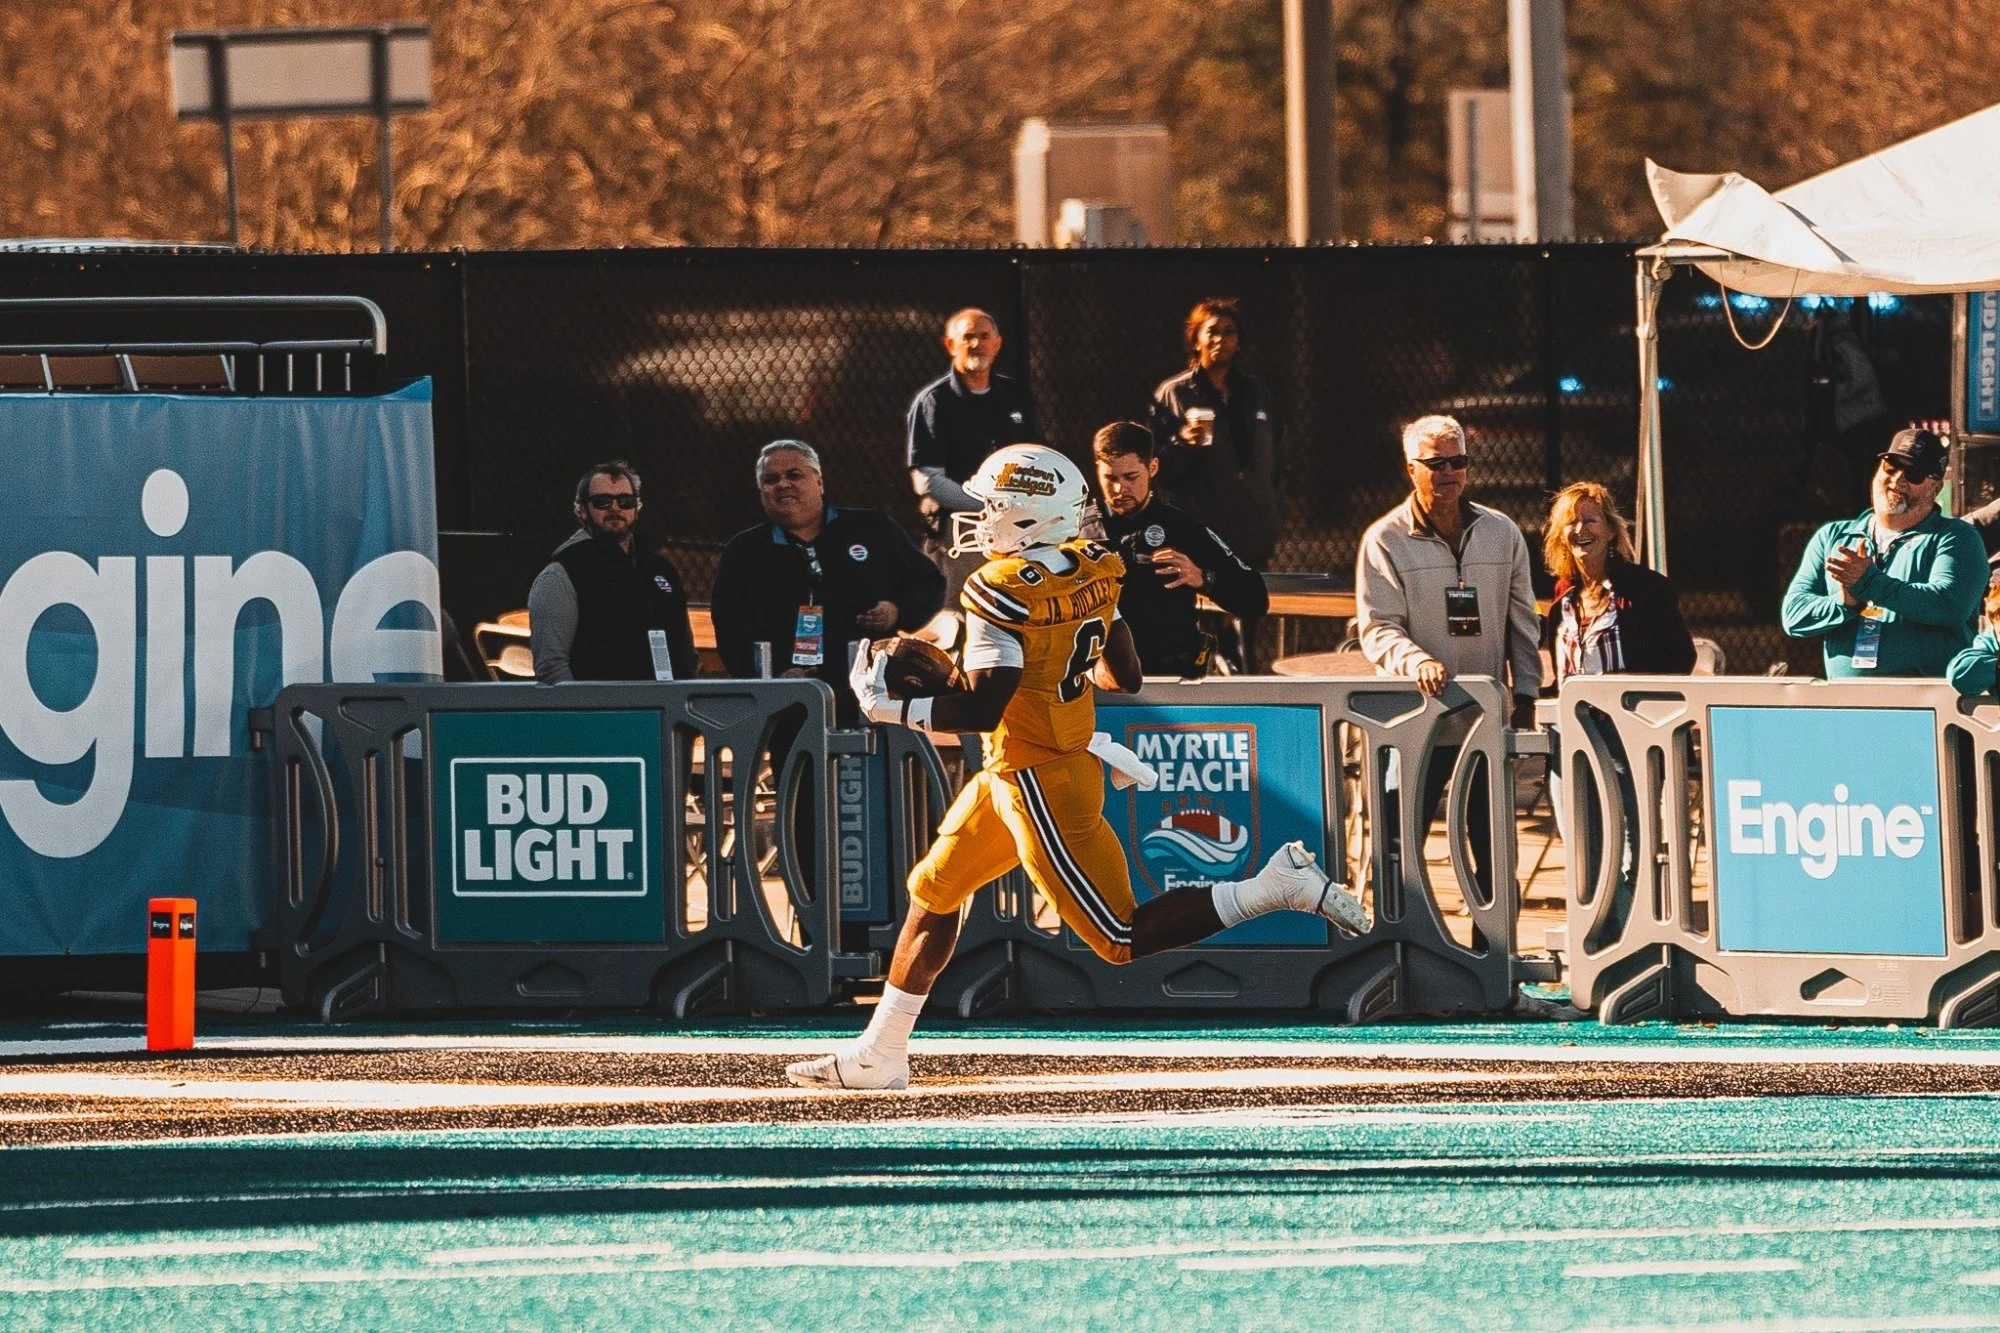
Myrtle Beach Bowl (Kennesaw State vs. Western Michigan): The model finished within ~1% of actual attendance by correctly capturing Myrtle Beach’s destination-bowl dynamic, consistent tourist-driven demand, and a venue size that naturally limits variance, resulting in turnout that closely tracked historical norms regardless of participant travel distance.
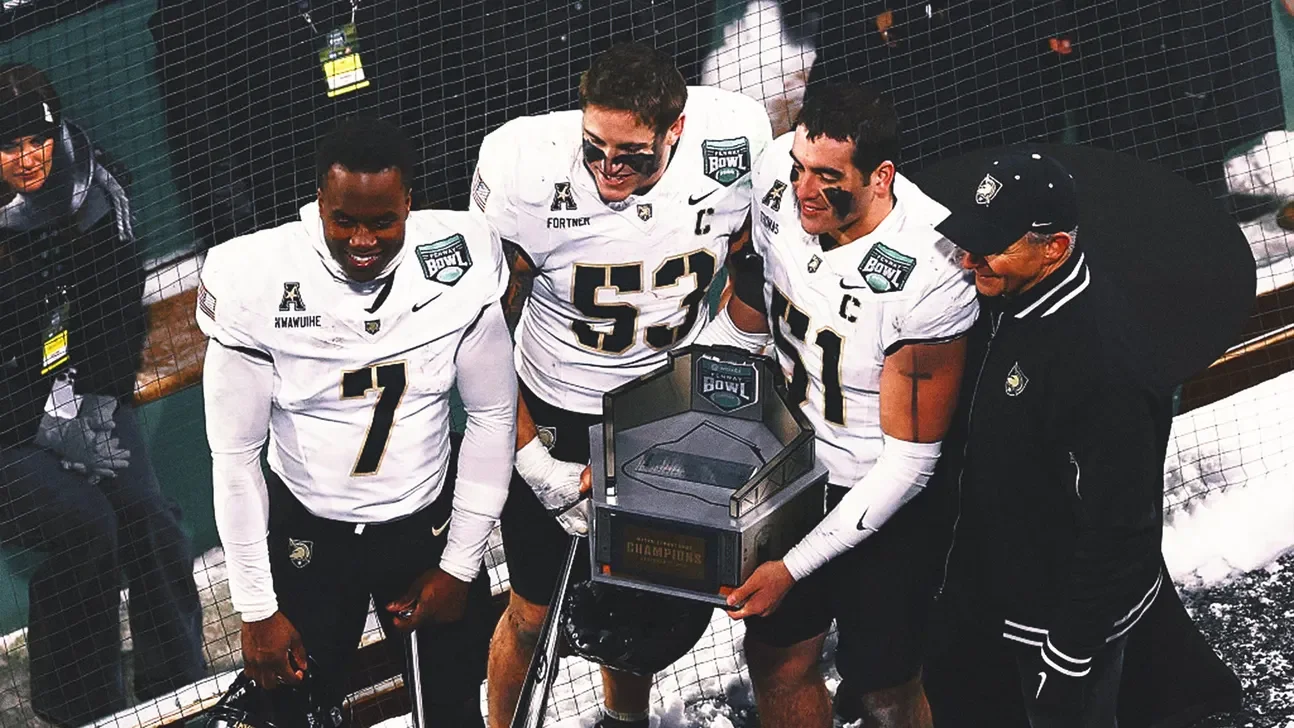
Wasabi Fenway Bowl (UConn vs. Army): Attendance landed within 3.55% of projection as the model accurately reflected the combined impact of UConn’s near-home proximity, Army’s nationally distributed alumni base, and Fenway Park’s novelty appeal, which sustained demand despite cold-weather conditions.
Where it was directionally right
StaffDNA Cure Bowl (Old Dominion vs. USF): The model correctly identified strong regional interest for a highly drivable matchup, though actual turnout showed that regional enthusiasm does not always convert proportionally into paid attendance.
Idaho Potato Bowl (Washington State vs. Utah State): Attendance exceeded both the historical average and the projection, underscoring how strong regional proximity can meaningfully elevate demand in cold-weather bowls beyond typical baseline expectations.
Where it missed (and why that matters)
Gasparilla Bowl (Memphis vs. NC State): Attendance fell well below expectations, illustrating that brand strength and Power Conference affiliation alone are insufficient to drive turnout in saturated Florida markets without a clear local or near-local fanbase anchor.
Birmingham Bowl (Georgia Southern vs. Appalachian State): Despite apparent regional proximity, limited travel accessibility and overlapping fanbase footprints constrained attendance, highlighting that practical ease of travel and local market appeal matter more than distance alone for neutral-site bowls.
WHAT DROVE ATTENDANCE VARIANCE
Attendance variance in 2025 was not evenly distributed. There are larger gaps concentrated around a few factors between projected and actual attendance.
Common characteristics of higher-variance games included:
Travel Feasibility vs Travel Distance
The Role of Fan Expectations
Matchups without a true regional fanbase
Large NFL venues located in lower-demand bowl markets
Smaller fanbases playing in-state or regional assumptions that did not translate into actual travel
Situations where local demand played a larger role than historical averages suggested
These patterns reinforced that attendance outcomes depend heavily on context.
More Details on the Two Key Model Variables
Travel Feasibility vs Travel Distance
A key takeaway from 2025 was the distinction between travel distance and travel feasibility.
Miles traveled measured actual distance, but did not always reflect how feasible travel was for fans. Games with short turnaround times, reliance on flights, or limited destination appeal often underperformed beyond what distance alone would predict.
In these cases, logistical issues, rather than geography alone, played a significant role in the reduced attendance.
The Role of Fan Expectations
Another consistent theme in 2025 was the impact of fan expectations and emotional context. Attendance varied significantly based on how fans viewed the season and the bowl:
Programs accustomed to CFP-level success frequently drew less interest in non-CFP bowls
First-time or long-absent bowl teams frequently exceeded expectations due to novelty and excitement
Teams finishing around .500 underperformed when the season felt disappointing relative to recent years
These conditions showed that bowl attendance is determined by matchup quality, location, fan sentiment, and perceived stakes.
KEY TAKEAWAYS
The 2025 bowl season reinforced several key points regarding attendance forecasting:
Relative demand is more predictable than exact attendance totals
A small number of factors drive a disproportionate share of variance
Fan behavior is shaped as much by context and perception as by geography and brand
Overall, the model was effective as a comparative and directional tool. The 2025 results provided valuable insight into how bowl-specific dynamics affect real-world attendance, and the 2026 model will undoubtedly demonstrate increased accuracy.