INDUSTRY INSIGHTS
ANALYSIS & PERSPECTIVES ON SPORTS MEDIA, VIEWERSHIP, AND DATA-DRIVEN STRATEGY
2025 Bowl Season Attendance Outlook: What Our Model Predicts and Why
12/11/2025
Despite realignment, NIL-era roster movement, and evolving media consumption, one thing remains stable: bowl attendance continues to follow clear, consistent patterns.
After analyzing hundreds of postseason games and dozens of possible independent variables, our model identified these four primary drivers of turnout, in no particular order:
Fanbase size: Aggregated from social following, enrollment, alum totals, and dispersion data
Distance to the bowl host city: Shorter distances from home campuses to the host city correlate strongly with higher attendance, especially for regional bowls
National brand power: National visibility, historical performance, and program perception drive interest and ticket demand
Roster talent + season performance: Higher win totals and stronger talent profiles contribute to greater fan momentum entering bowl season
When applied to the 2025 bowl season slate, these drivers highlight a series of compelling matchups across the postseason, many of which show strong engagement indicators and unique characteristics.
Overall, the 2025 bowl slate shows strong alignment among matchup geography, fanbase size, and historical bowl attendance. While individual bowl results will vary, the season’s structure reflects clear engagement patterns that our model has successfully captured across hundreds of games.
*NOTE: All projections were finalized the Week of 12/8, before kickoff of the first game (Bucked Up LA Bowl).
BOWL GAME ATTENDANCE ANALYSIS 2025
Bucked-Up LA Bowl Hosted by Gronk– Boise State vs. Washington
Date: December 13, 2025
Venue: SoFi Stadium – Inglewood, CA (70,240 capacity)
Predicted Attendance: 27,287 (38% capacity)
Historical Avg: 29,868 (42% capacity)
Key Drivers:
This year marks the first time since 2021 that the LA Bowl does not feature a California-based school
Boise State and Washington both have strong West Coast followings and traveling fanbases, but must travel further that past participants (minimum ~600 miles)
Washington’s brand power helps stabilize attendance despite travel distance
SoFi Stadium offers visibility and tourism appeal
Attendance in this bowl has historically been strongest when at least one participant is regionally based. This projection aligns with past outcomes for matchups requiring longer travel.
IS4S Salute to Veterans Bowl– Troy vs. Jacksonville State
Date: December 16, 2025
Venue: Cramton Bowl — Montgomery, AL (21,000 capacity)
Predicted Attendance: 18,379 (88% capacity)
Historical Avg: 13,316 (63% capacity)
Key Drivers:
A regional pairing that benefits strongly from proximity. This is one of the most travel-convenient travel matchups of the early bowl season
Very drivable for both fanbases (within ~100 miles), which historically boosts bowl attendance due to same-day travel feasibility.
Strong Southeast alum density
Regional matchups have consistently produced higher-than-average turnout for this bowl, and the projection aligns with those historical results.
68 Ventures Bowl– Louisiana vs. Delaware
Date: December 17, 2025
Venue: Hancock Whitney Stadium — Mobile, AL (25,450 capacity)
Predicted Attendance: 20,536 (81% capacity)
Historical Avg: 20,340 (80% capacity)
Key Drivers:
Louisiana close regional proximity (~230 miles)
Louisiana’s fanbase helps keep attendance in line with historical expectations
Mobile, AL bowl games traditionally draw well for competitive group of 5 pairings
Projected attendance largely mirrors historical performance, which has remained stable for regional pairings of this type.
StaffDNA Cure Bowl– Old Dominion vs. USF
Date: December 17, 2025
Venue: FBC Mortgage Stadium — Orlando, FL (60,219 capacity)
Predicted Attendance: 12,155 (20% capacity)
Historical Avg: 11,183 (19% capacity)
Key Drivers:
One of the most travel-friendly matchups of bowl season due to USF’s proximity.
USF benefits from a near-home environment (~70 miles from the venue)
Orlando historically boosts attendance when featuring Florida programs
Large venue size and pre-holiday timing have historically led to lower percentage fills for this bowl. The projection aligns closely with those trends.
Union Home Mortgage Gasparilla Bowl– Memphis vs. NC State
Date: December 19, 2025
Venue: Raymond James Stadium – Tampa, FL (65,857 capacity)
Predicted Attendance: 33,504 (51% capacity)
Historical Avg: 35,374 (54% capacity)
Key Drivers:
Similar travel distances for both teams (~600 miles) with no clear geographic advantage
NC State’s larger fanbase and higher brand power typically translates into stronger bowl travel
Power conference presence supports demand and lifts casual interest
Attendance at this bowl has historically been shaped by regional reach and conference affiliation. This projection fits within established patterns for similar matchups.
Myrtle Beach Bowl Presented by Engine– Kennesaw State vs. Western Michigan
Date: December 19, 2025
Venue: Brooks Stadium – Conway, SC (21,000 capacity)
Predicted Attendance: 9,192 (44% capacity)
Historical Avg: 9,415 (45% capacity)
Key Drivers:
Myrtle Beach is a destination bowl, which entices fans to travel regardless of the distance
Typical matchup for this particular bowl game, data supports predicted attendance consistent with historical avg
Percentage fills for this bowl have typically remained within this range given timing, venue size, and matchup profile.
Famous Idaho Potato Bowl– Washington State vs. Utah State
Date: December 22, 2025
Venue: Albertsons Stadium – Boise, ID (36,387 capacity)
Predicted Attendance: 13,351 (37% capacity)
Historical Avg: 10,883 (30% capacity)
Key Drivers:
Shorter travel distances are a major attendance booster, especially for cold-weather bowls where proximity becomes critical
Both programs’ regional alum dispersion supports strong localized turnout
Historically, cold-weather bowls show lower percentage fills even with regional teams. This projection aligns with that long-term trend.
The Bush’s Boca Raton Bowl of Beans– Louisville vs. Toledo
Date: December 23, 2025
Venue: FAU Stadium – Boca Raton, FL (30,000 capacity)
Predicted Attendance: 18,651 (62% capacity)
Historical Avg: 20,667 (69% capacity)
Key Drivers:
Both teams travel over 600 miles, historically decreasing attendance for pre-Christmas bowls
Louisville’s larger fanbase and brand power help offset long-distance drawbacks
Power conference presence supports demand and lifts casual interest
This bowl often varies significantly by timing and travel load. The projection reflects turnout patterns typically associated with non-regional matchups.
The Scooter’s Coffee Frisco Bowl– UNLV vs. Ohio
Date: December 23, 2025
Venue: Toyota Stadium – Frisco, TX (12,000 capacity)
Predicted Attendance: 10,582 (88% capacity)
Historical Avg: 11,816 (57% capacity) *Previously held at Toyota Center (20,500 capacity)
Key Drivers:
Both teams travel over 900 miles, which usually lowers attendance for Group of 5 bowls
UNLV’s talent composition creates more on-field draw, moderating attendance drop-off
Turnout typically lands within this range when both participants face long-distance travel.
New Orleans Bowl– Western Kentucky vs. Southern Miss
Date: December 23, 2025
Venue: Caesars Superdome – New Orleans, LA (41,426 capacity)
Predicted Attendance: 13,407 (32% capacity)
Historical Avg: 13,697 (33% capacity)
Key Drivers:
Southern Miss’s short travel (~100 miles) strongly boosts turnout, particularly for a pre-Christmas game where long-distance travel is limited
Turnout has historically been consistent for this bowl, especially when featuring a regional participant.
Sheraton Hawai’i Bowl– Hawaii vs. Cal
Date: December 23, 2025
Venue: Clarence T.C. Ching Stadium – Honolulu, HI (15,194 capacity)
Predicted Attendance: 9,410 (62% capacity)
Historical Avg: 6,805 (45% capacity)
Key Drivers:
Bowl attendance is shaped almost entirely by Hawaii’s local presence
Hawaii makes an appearance for the first time since 2021
Holiday-week timing boosts local turnout in Honolulu
Attendance traditionally reflects Hawaii’s drawing power and localized fan base. This projection aligns with historical behavior for this event.
Servpro First Responder Bowl– FIU vs. UTSA
Date: December 23, 2025
Venue: Gerald J. Ford Stadium – Dallas, TX (32,000 capacity)
Predicted Attendance: 20,463 (64% capacity)
Historical Avg: 21,870 (68% capacity)
Key Drivers:
UTSA benefits from in-state proximity, historically a major factor in Texas bowl attendance
FIU’s large fanbase provides wider pool of potential travelers despite longer distance
Featuring a Texas program boosts attendance for Dallas-based bowls
Turnout for this bowl has generally tracked closely with the presence of a Texas program. This projection fits that pattern.
GameAbove Sports Bowl– Central Michigan vs. Northwestern
Date: December 26, 2025
Venue: Ford Field – Detroit, MI (65,000 capacity)
Predicted Attendance: 26,207 (40% capacity)
Historical Avg: 25,909 (40% capacity)
Key Drivers:
Reasonable travel distance for both teams (less than 240 miles) increases same-day attendance potential
Northwestern’s large fanbase and high brand power help elevate demand beyond typical MAC-level turnout
Indoor venue eliminates weather-related variation, supporting stable attendance
Attendance for this bowl has historically tracked with regional accessibility and brand presence. The projection closely mirrors past outcomes.
Rate Bowl– New Mexico vs. Minnesota
Date: December 26, 2025
Venue: Sun Devil Stadium – Tempe, AZ (40,033 capacity)
Predicted Attendance: 23,262 (47% capacity)
Historical Avg: 23,775 (48% capacity)
Key Drivers:
New Mexico benefits from being regionally located (less than 330 miles), historically a strong indicator for this bowl
Minnesota’s large fanbase supports long-distance bowl travel, and the team’s brand and talent increases interest from neutral fans
Turnout for this bowl has historically aligned with regional representation balanced by a strong-traveling visiting fanbase. This projection reflects those dynamics.
Snoop Dogg Arizona Bowl presented by Gin & Juice by Dre and Snoop– Miami (OH) vs. Fresno State
Date: December 27, 2025
Venue: Arizona Stadium – Tucson, AZ (50,782 capacity)
Predicted Attendance: 34,728 (68% capacity)
Historical Avg: 32,732 (64% capacity)
Key Drivers:
Fresno State’s moderate travel range supports a decent turnout from its regional fanbase
Miami (OH)’s long travel lowers expected representation, shifting the attendance load toward Fresno
Historical attendance has been notably influenced by regional participation. This projection reflects that established pattern.
Wasabi Fenway Bowl– UConn vs. Army
Date: December 27, 2025
Venue: Fenway Park – Boston, MA (37,755 capacity)
Predicted Attendance: 21,665 (57% capacity)
Historical Avg: 20,313 (54% capacity)
Key Drivers:
UConn’s extremely close proximity (~70 miles) provides a strong built-in attendance base
Army’s extensive national alum network reliably supports bowl travel regardless of location
Fenway’s novelty as a bowl venue consistently boosts neutral and local attendance
This bowl has historically benefited from regional matchups and novelty appeal. The projection is consistent with past outcomes.
TaxSlayer Gator Bowl– Missouri vs. Virginia (19)
Date: December 27, 2025
Venue: EverBank Stadium – Jacksonville, FL (67,814 capacity)
Predicted Attendance: 48,835 (72% capacity)
Historical Avg: 53,758 (79% capacity)
Key Drivers:
Both teams travel comparable distances, creating balanced fan representation
Power conference matchup with competitive profiles helps maintain demand near the historical average
Historically, this bowl performs strongest with high-brand matchups. This projection fits the expected range for a balanced, mid-distance pairing.
Military Bowl presented by GoBowling.com– Pittsburgh vs. East Carolina
Date: December 27, 2025
Venue: Navy–Marine Corps Stadium – Annapolis, MD (34,000 capacity)
Predicted Attendance: 26,220 (77% capacity)
Historical Avg: 25,935 (76% capacity)
Key Drivers:
Nearly identical travel distances (~225 miles) create an evenly accessible matchup
Pittsburgh's large fanbase provides additional stability in turnout
Strong regional alum concentrations for both programs support drive-in attendance
The bowl historically benefits from regional proximity for both teams. This projection aligns closely with prior years’ performance.
Isleta New Mexico Bowl– North Texas vs. San Diego State
Date: December 27, 2025
Venue: University Stadium – Albuquerque, NM (39,224 capacity)
Predicted Attendance: 24,747 (63% capacity)
Historical Avg: 25,268 (64% capacity)
Key Drivers:
Both teams travel mid-range distances, reducing disparity in attendance share
Large fanbases on both sides help maintain turnout levels consistent with the bowl’s historical average despite the longer travel distances
Attendance has historically remained stable for matchups without a local or near-local team. The projection mirrors this consistency.
Bad Boy Mowers Pinstripe Bowl– Clemson vs. Penn State
Date: December 27, 2025
Venue: Yankee Stadium – New York, NY (50,291 capacity)
Predicted Attendance: 37,335 (74% capacity)
Historical Avg: 32,169 (64% capacity)
Key Drivers:
Penn State benefits from very short travel (~200 miles), historically a major driver of bowl game turnout in the Northeast
Clemson adds another large national fanbase, boosting demand beyond average levels of the bowl
High-profile brands generate strong neutral-market attendance in New York
Penn State has a massive alum-base in New York City, significantly boosting attendance
This bowl has historically seen significant lifts when featuring at least one large-brand, short-travel program. The projection aligns closely with that behavior.
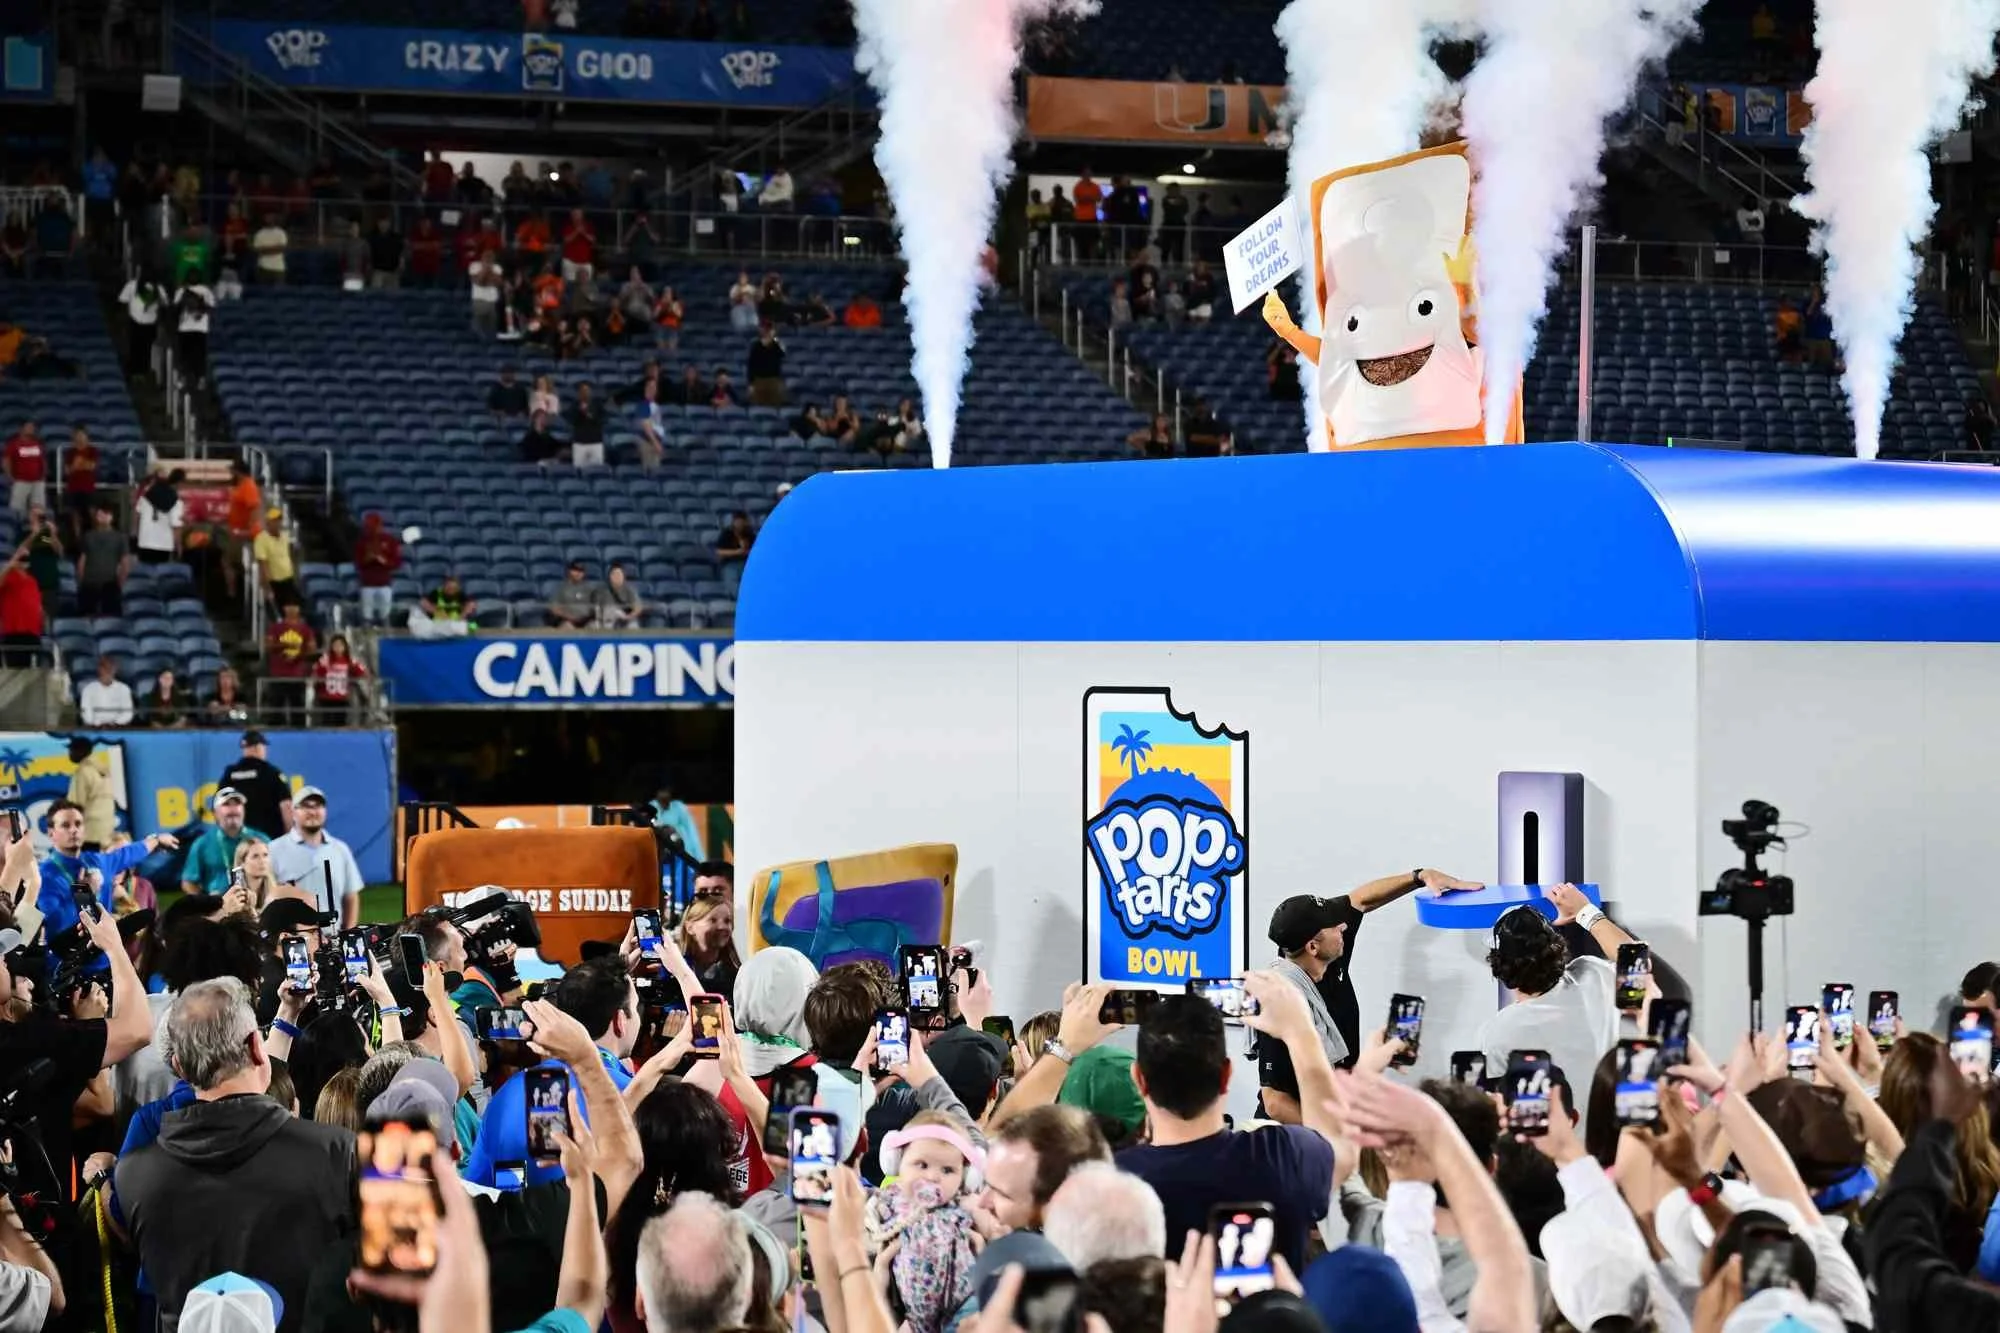
Pop-Tarts Bowl– BYU (12) vs. Georgia Tech (22)
Date: December 27, 2025
Venue: Camping World Stadium – Orlando, FL (60,219 capacity)
Predicted Attendance: 40,297 (67% capacity)
Historical Avg: 43,760 (72% capacity)
Key Drivers:
BYU’s extensive alum dispersion supports national travel despite extremely long distance
Georgia Tech’s shorter travel provides strong Southeastern fan presence
Both team’s sizable fan bases contribute to a stable attendance floor
Attendance for this bowl often reflects the balance of a national-traveling fanbase paired with a regional program. This projection aligns with historical outcomes for similar matchups.
Note: Our model shows that if Notre Dame had been slotted into the Pop-Tarts Bowl, attendance would rise to 50,340, more than 6,000 above the bowl’s historical average. This uplift is driven by Notre Dame’s unmatched national fanbase reach and strong travel behavior.
Kinder’s Texas Bowl– LSU vs. Houston
Date: December 27, 2025
Venue: NRG Stadium – Houston, TX (71,795 capacity)
Predicted Attendance: 48,720 (68% capacity)
Historical Avg: 54,232 (76% capacity)
Key Drivers:
Houston is effectively the home team (single digit travel miles), providing a major attendance anchor
LSU’s short travel (~250 miles) and elite fanbase size drive strong regional turnout
Turnout typically surges when at least one participant is Texas-based. This projection reflects established behavior for similar SEC–AAC or SEC–Big 12 matchups.
The JLab Birmingham Bowl– Georgia Southern vs. App State
Date: December 29, 2025
Venue: Protective Stadium – Birmingham, AL (47,100 capacity)
Predicted Attendance: 22,721 (48% capacity)
Historical Avg: 23,25 (49% capacity)
Key Drivers:
Nearly identical travel distances ensure balanced fan turnout
Both alum bases are regionally located, supporting potential drive-in attendance
Rivalry-style profile enhances regional engagement, keeping attendance on par with historical averages
Birmingham bowls with regional Group of Five matchups have historically produced turnout within this range. The projection aligns closely with prior years.
Valero Alamo Bowl– USC (16) vs. TCU
Date: December 30, 2025
Venue: Alamodome – San Antonio, TX (64,000 capacity)
Predicted Attendance: 56,649 (89% capacity)
Historical Avg: 60,958 (95% capacity)
Key Drivers:
TCU’s shorter travel supports a strong in-state turnout
USC’s large, national fanbase and high brand power help offset the long-distance travel
The Alamo Bowl has consistently delivered strong attendance for high-profile Power Conference matchups. This projection fits established long-term performance.
Radiance Technologies Independence Bowl– Coastal Carolina vs. Louisiana Tech
Date: December 30, 2025
Venue: Independence Stadium – Shreveport, LA (50,000 capacity)
Predicted Attendance 29,672 (59% capacity)
Historical Avg: 30,255 (61% capacity)
Key Drivers:
Louisiana Tech benefits from extremely short travel (~65 miles), a major boost for this bowl historically
Coastal Carolina’s longer travel remains typical with Sun Belt Conference’s travel habits
Turnout for this bowl has traditionally been strongest with a near-local participant. This projection reflects those dynamics.
The Liberty Mutual Music City Bowl– Tennessee vs. Illinois
Date: December 30, 2025
Venue: Nissan Stadium – Nashville, TN (68,798 capacity)
Predicted Attendance: 47,128 (69% capacity)
Historical Avg: 45,258 (66% capacity)
Key Drivers:
Tennessee’s very close travel (~160 miles), creates on of the strongest attendance advantages in bowl season
Illinois’ drivable distance (~282 miles) supports meaningful fan turnout
Tennessee’s larger fanbase uplifts demand slightly above historical norms
When featuring a near-local SEC program, this bowl has historically exceeded its baseline. This projection aligns with that pattern.
Cheez-It Citrus Bowl– Michigan (18) vs. Texas (13)
Date: December 31, 2025
Venue: Camping World Stadium – Orlando, FL (60,219 capacity)
Predicted Attendance: 52,137 (87% capacity)
Historical Avg: 43,326 (72% capacity)
Key Drivers:
Two of the largest fanbases in the country dramatically expand attendance potential
High brand and talent profiles elevate national interest well-above typical non-CFP bowl game levels
Balance travel distances support strong fan turnout on both sides
*The recent news on Michigan’s coaching situation may have an impact on attendance that cannot currently be projected
This bowl typically performs well with marquee matchups. The projection aligns with turnout levels observed when featuring two national brands.
SRS Distribution Las Vegas Bowl– Nebraska vs. Utah (15)
Date: December 31, 2025
Venue: Allegiant Stadium – Las Vegas, NV (65,000 capacity)
Predicted Attendance: 24,760 (38% capacity)
Historical Avg: 25,773 (40% capacity)
Key Drivers:
Utah benefits from being regionally located, supporting strong representation
Nebraska’s historically reliable bowl travel offsets long-distance demands
Destination setting improves neutral and non-aligned attendance
This bowl has historically produced mid-range turnout when featuring one regional and one long-distance participant. The projection tracks closely with past behavior.
Reliaquest Bowl– Iowa (23) vs. Vanderbilt (14)
Date: December 31, 2025
Venue: Raymond James Stadium – Tampa, FL (65,857 capacity)
Predicted Attendance: 33,416 (51% capacity)
Historical Avg: 33,611 (51% capacity)
Key Drivers:
Iowa’s large fanbase helps overcome long-distance travel to Florida bowls
Vanderbilt's moderate travel distance enhances fan turnout
Balanced Power 4 matchup yields consistent attendance patterns
Turnout has historically remained steady when the matchup includes at least one high-travel fanbase. This projection reflects that trend.
Tony the Tiger Sun Bowl– Arizona State vs. Duke
Date: December 31, 2025
Venue: Sun Bowl Stadium – El Paso, TX (52,000 capacity)
Predicted Attendance: 43,968 (85% capacity)
Historical Avg: 44,664 (86% capacity)
Key Drivers:
Arizona State’s regional location strengthens turnout
Duke’s extensive alum dispersion often offsets long-distance travel
Both teams’ large fanbases support stable demand
The Sun Bowl has traditionally delivered strong attendance with regional representation paired with a national-alumni program. This projection is consistent with those outcomes.
Lockheed Martin Armed Forces Bowl– Texas State vs. Rice
Date: January 2, 2026
Venue: Amon G. Carter Stadium – Fort Worth, TX (47,000 capacity)
Predicted Attendance: 42,822 (91% capacity)
Historical Avg: 41,819 (89% capacity)
Key Drivers:
Average travel distance is ~217 miles, enabling drive-in attendance
Regional alum bases for in-state programs enhance turnout
This bowl has historically excelled when featuring two Texas programs, and the projection aligns with those results.
Duke’s Mayo Bowl– Mississippi State vs. Wake Forest
Date: January 2, 2026
Venue: Bank of America Stadium – Charlotte, NC (75,523 capacity)
Predicted Attendance: 38,281 (51% capacity)
Historical Avg: 37,360 (49% capacity)
Key Drivers:
Wake Forest’s extremely close travel (~70 miles) drives strong fan turnout
Mississippi State’s larger fanbase supports meaningful long-distance turnout
SEC-ACC structure historically drives demand in Charlotte, regardless of matchup
This bowl consistently performs within this range for matchups featuring a local ACC program paired with a traveling SEC team. The projection reflects that pattern.
Trust & Will Holiday Bowl– Arizona vs. SMU
Date: January 2, 2026
Venue: Petco Park – San Diego, CA (35,000 capacity)
Predicted Attendance: 32,215 (92% capacity)
Historical Avg: 31,826 (91% capacity)
Key Drivers:
Arizona benefits from being regionally located
SMU’s long travel (~1100 miles) lowers expected representation, increasing Arizona’s impact on total turnout
Arizona’s strong talent and brand elevate matchup appeal
The Holiday Bowl has long performed strongest with a regional participant. This projection mirrors that trend.
AutoZone Liberty Bowl– Navy vs. Cincinnati
Date: January 2, 2026
Venue: Simmons Bank Liberty Stadium – Memphis, TN (50,000 capacity)
Predicted Attendance: 44,620 (89% capacity)
Historical Avg: 46,467 (93% capacity)
Key Drivers:
Navy’s extensive alum network reliably supports bowl game attendance nationwide
Cincinnati's moderate travel drives regional turnout
Both programs possess large, engaged fanbases contributing to elevated attendance potential, bringing projected attendance closer to historical average
This bowl has historically performed well with large fanbases and regional pairing structures. The projection aligns with past patterns.
POWERED BY OPTIMATCH
These attendance projections were generated using Optimatch, CSMG’s data-driven matchup optimization platform. Optimatch integrates key variables such as fanbase size, travel distance, alum dispersion, brand strength, and matchup quality to forecast demand across college sports.
The tool’s ability to model attendance with an extremely low error rate underscores its reliability—not just for bowl season, but for regular-season scheduling, event planning, and strategic decision-making across our partner network.
Optimatch allows us to evaluate how specific matchup characteristics influence turnout and to compare projected attendance against historical benchmarks. These bowl forecasts showcase exactly how the platform can reveal demand patterns and help schools, conferences, and properties build higher-value game inventories.